
Risk Assessment of High-Growth AI Hardware Stocks Using Time Series Analysis
Published:
Overview
This project focuses on assessing the risk and return characteristics of high-growth AI hardware stocks during the ongoing AI boom. With the rise of large language models such as ChatGPT and Bard, companies like NVIDIA, AMD, Intel, and Qualcomm have become critical enablers of AI infrastructure.
Using time series analysis, this study evaluates historical stock performance, volatility, correlation, and risk-return trade-offs to provide actionable insights for investors.
Dataset & Tools
- Stocks Analyzed:
- NVIDIA (NVDA)
- AMD (Advanced Micro Devices)
- Intel (INTC)
- Qualcomm (QCOM)
Time Period:
September 2018 – September 2023 (1258 trading days per stock)Data Source:
Yahoo Finance (viayfinancePython library)- Libraries Used:
- Pandas
- NumPy
- Matplotlib
- Seaborn
Methodology
The analysis follows a structured, multi-step pipeline:
Data Collection
Historical stock price and volume data were fetched using Yahoo Finance.- Performance Analysis
- Closing price trends
- Daily trading volume patterns
- Trend Smoothing
- Moving averages (10, 20, 50 days) to reduce noise and reveal underlying trends
- Risk Measurement
- Daily percentage returns
- Volatility (standard deviation of returns)
- Correlation Analysis
- Pairwise stock correlations
- Heatmaps and scatter plots to understand co-movement behavior
- Risk–Return Tradeoff
- Efficient Frontier to compare expected return vs risk
Results & Analysis
Stock Price Performance
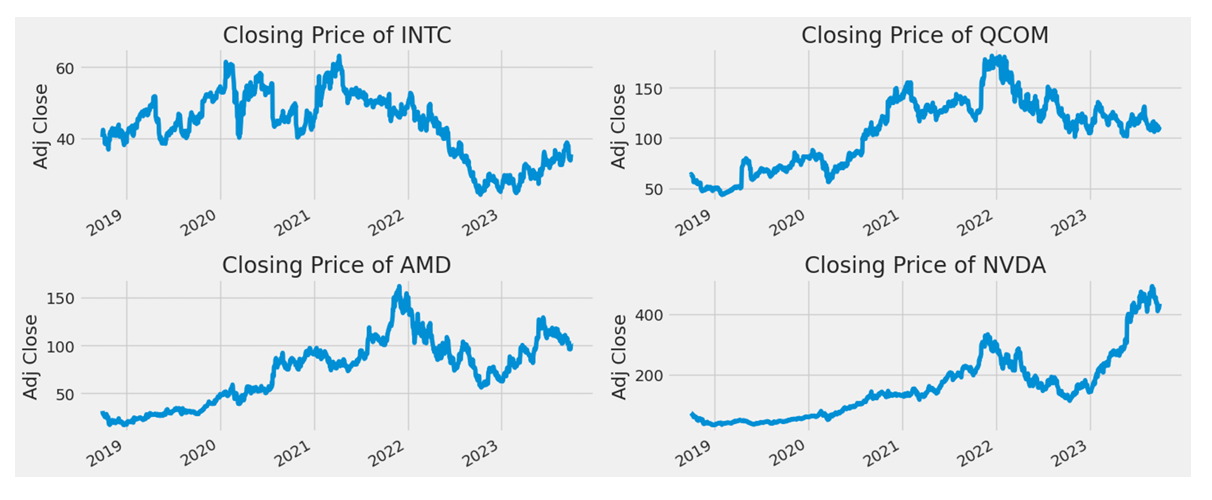
Figure 1: Evolution of daily closing prices for NVDA, AMD, QCOM, and INTC (2018–2023)
- NVIDIA showed exceptional growth (~573%)
- AMD followed with strong gains (~230%)
- Qualcomm delivered steady appreciation (~53%)
- Intel underperformed with an overall decline (~18%)
Trading Volume Trends
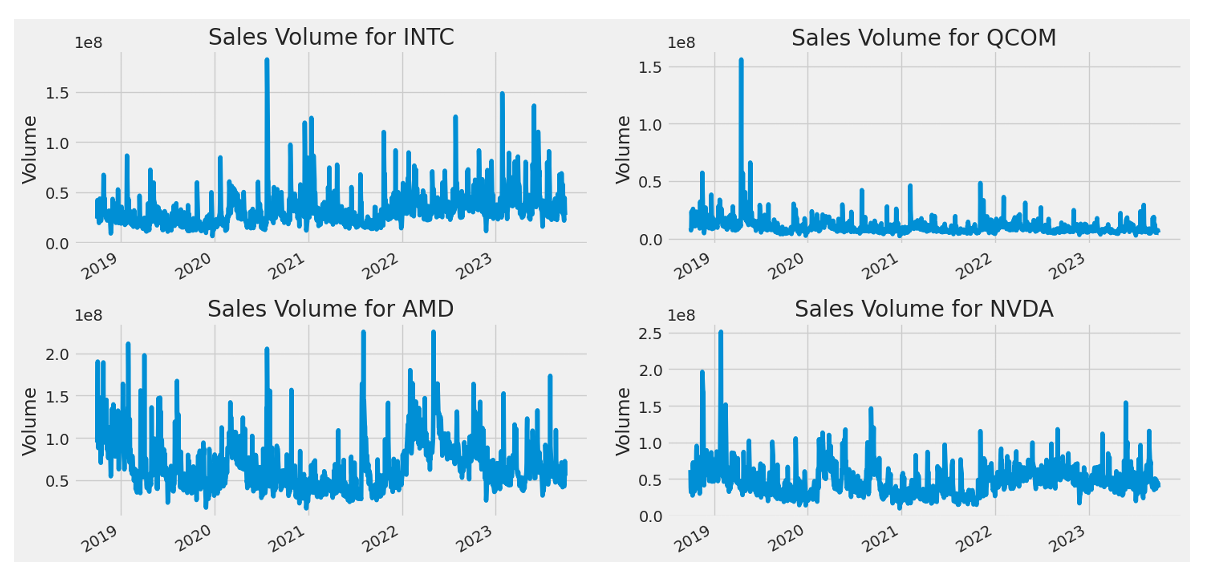
Figure 2: Daily trading volume comparison across AI hardware stocks
- AMD exhibited higher volatility
- Qualcomm remained relatively stable
- NVIDIA showed increasing participation over time
Moving Average Analysis
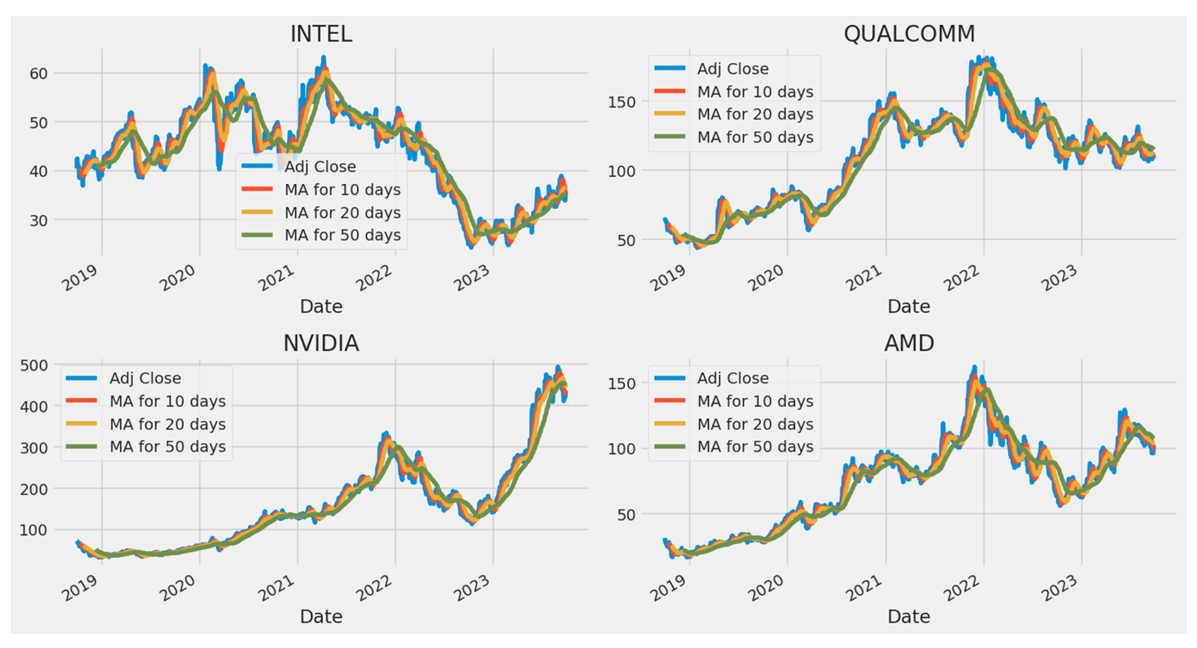
Figure 3: 10, 20, and 50-day moving averages
- 10- and 20-day averages best captured short-term trends
- Reduced noise without lagging excessively
Daily Return Volatility
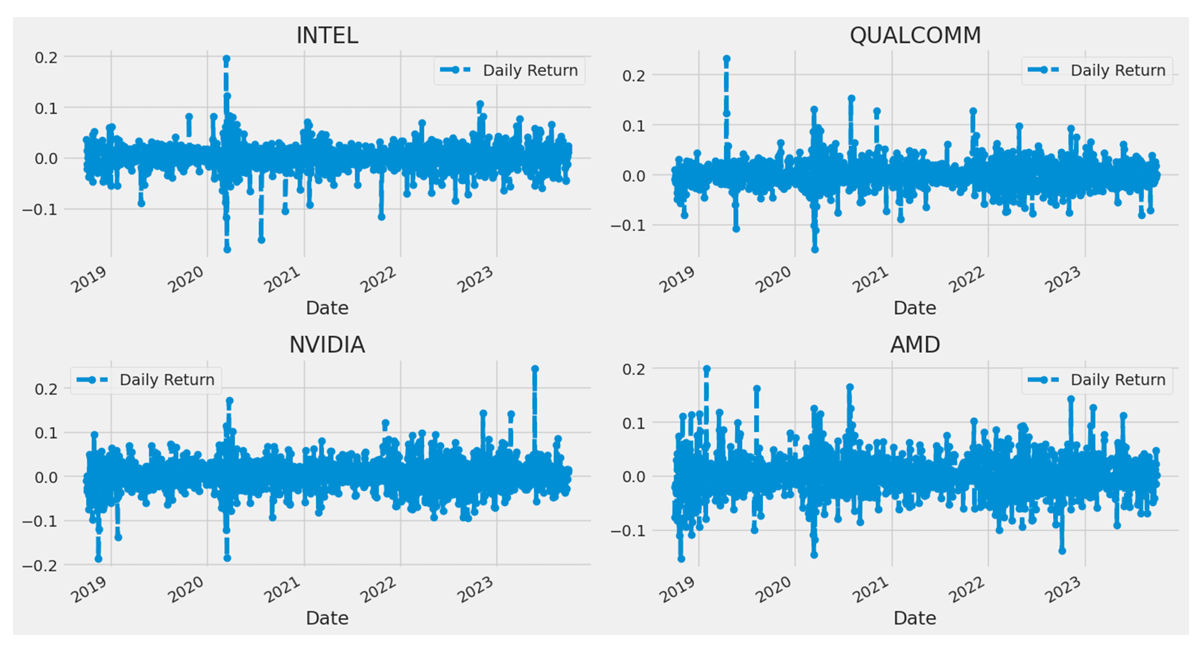
Figure 4: Daily percentage return fluctuations
- Intel: Least volatile (lower risk)
- AMD: Most volatile (highest risk)
- NVIDIA & Qualcomm: Moderate volatility with strong upside potential
Correlation Analysis
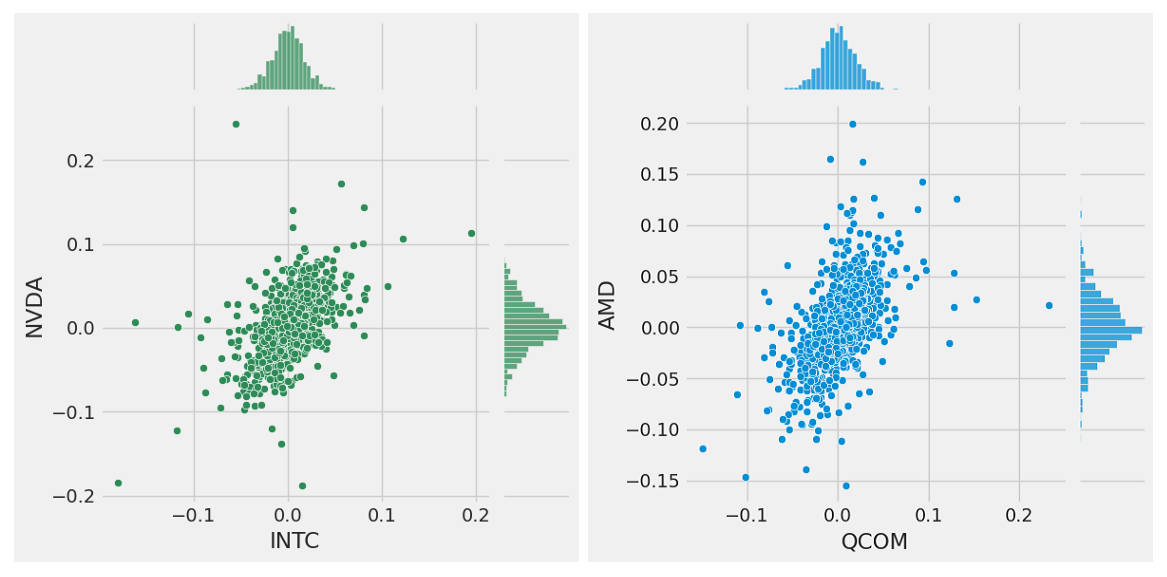
Figure 5: Daily return correlation between stock pairs
- Strong positive correlation observed between:
- NVDA & QCOM
- AMD & INTC
Correlation Heatmap
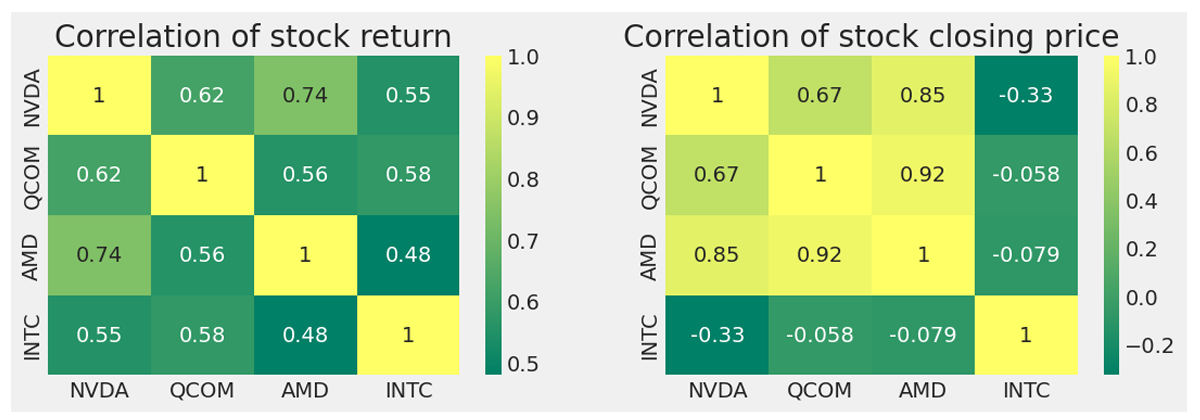
Figure 6: Correlation heatmap of daily returns and closing prices
- NVDA–AMD daily return correlation ≈ 0.74
- QCOM–AMD closing price correlation ≈ 0.92
- Highlights sector-wide systemic risk
Risk–Return Evaluation (Efficient Frontier)
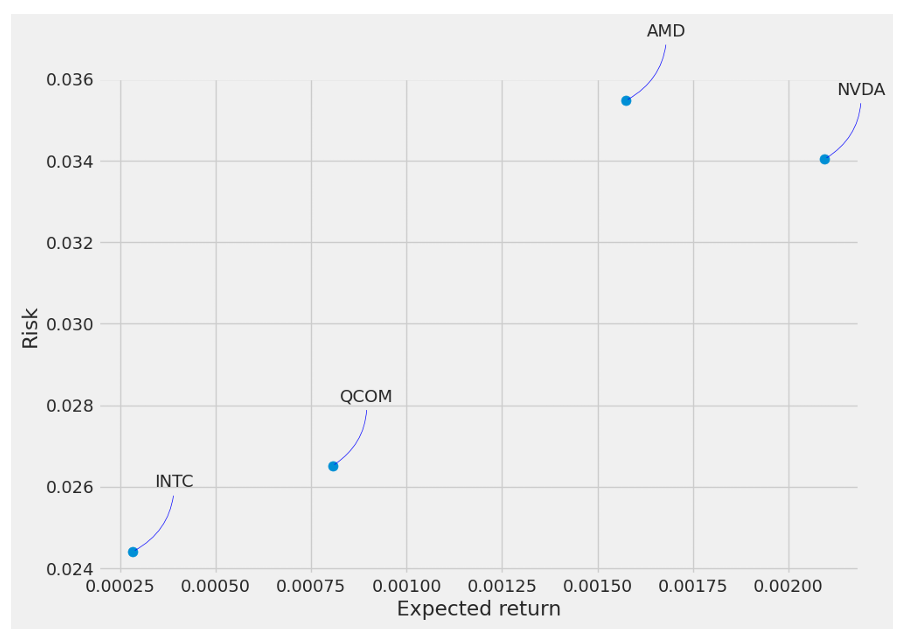
Figure 7: Efficient Frontier comparing expected return vs risk
- NVIDIA offered the highest expected returns
- Intel & Qualcomm showed lower risk profiles
- Demonstrates clear trade-offs between stability and growth
Conclusion
This project demonstrates how time series analysis and statistical modeling can be effectively applied to evaluate investment risk in high-growth AI hardware stocks.
Key takeaways:
- NVIDIA leads in returns but carries moderate risk
- AMD offers high growth with high volatility
- Intel provides relative stability but limited upside
- Correlation analysis reveals strong sector coupling, increasing systemic risk
The framework presented here can be extended to portfolio optimization, forecasting, and ML-based risk prediction models.
Skills Demonstrated
- Time Series Analysis
- Financial Data Analytics
- Risk Assessment
- Data Visualization
- Python for Finance
- Quantitative Investment Research